Traffic and Conversion elements go a long way in helping you visualize the flow of traffic through your funnel or campaign.
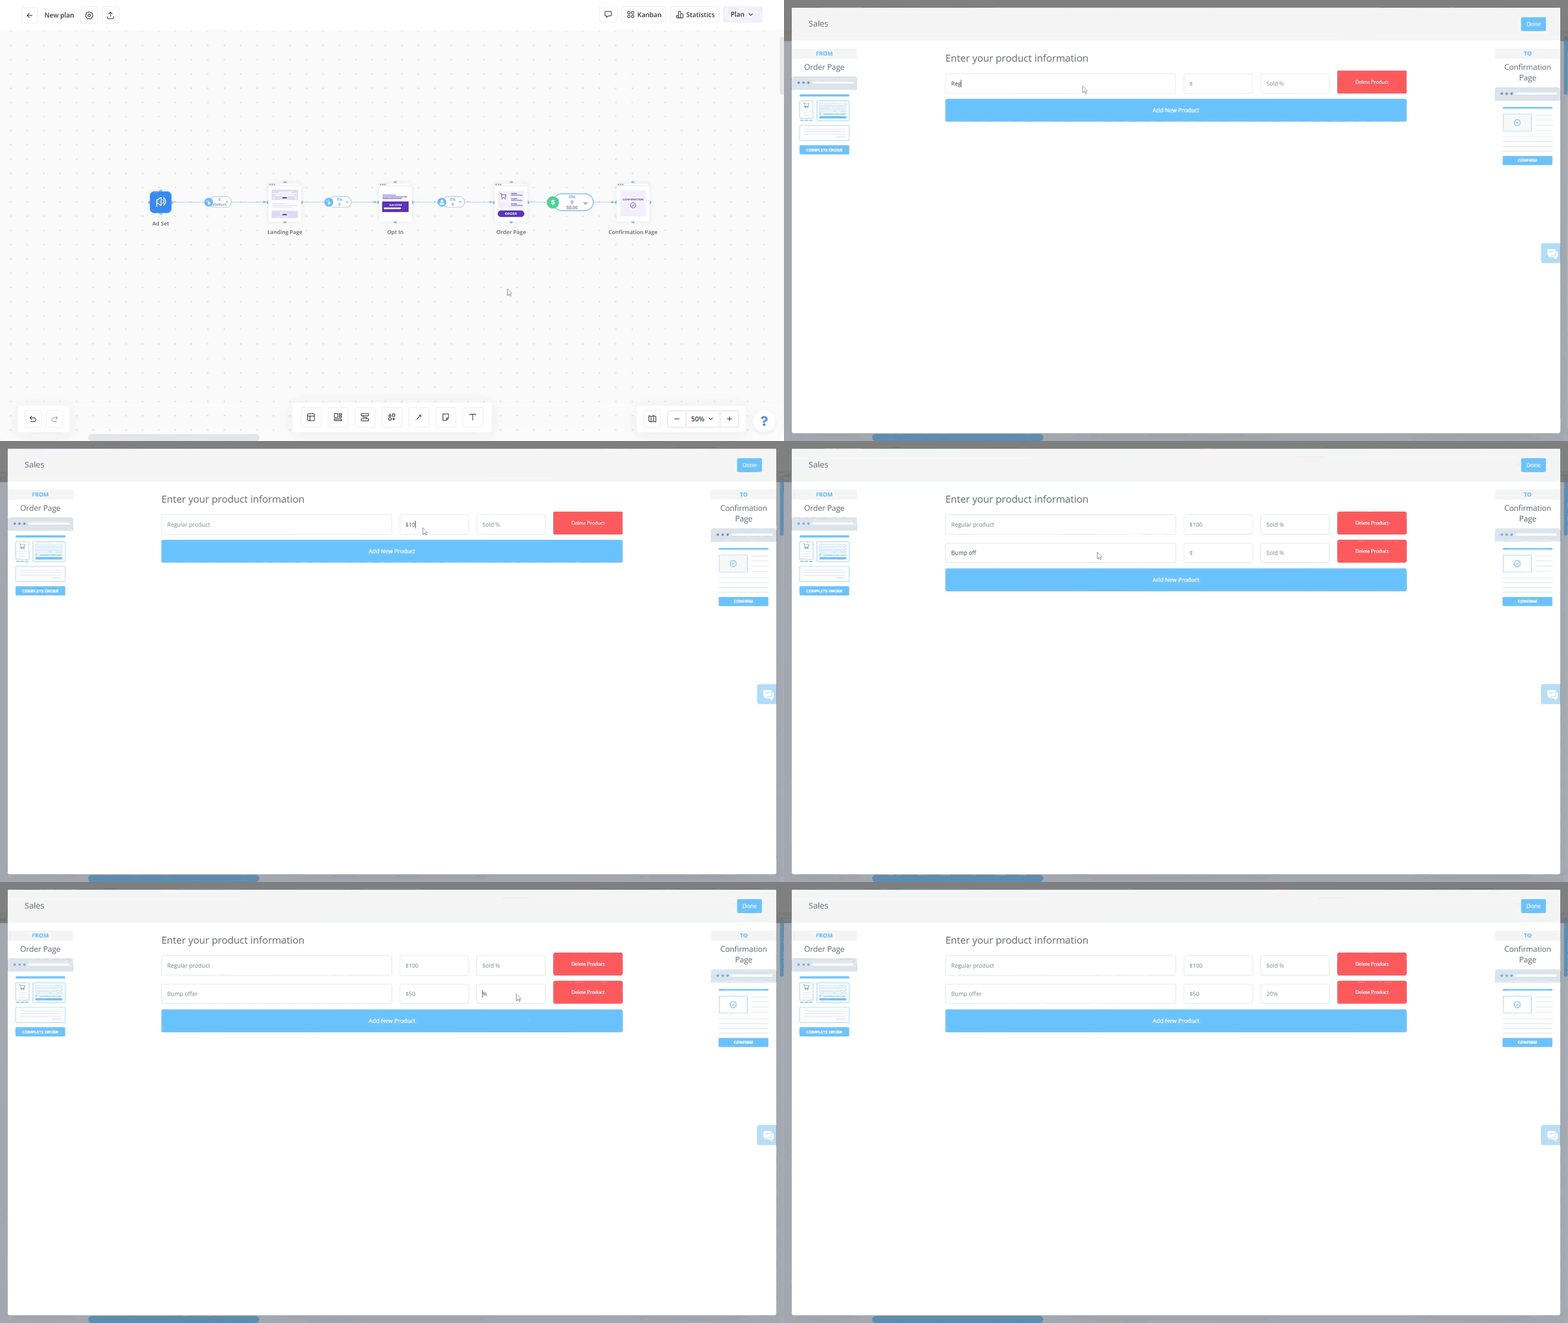
As you connect pages together, the appropriate traffic or conversion element will appear in-between them to make sense of your traffic. When you first connect a module to another inside of a plan, a Visitor box will appear. In these boxes, put in the number of visitors you expect to come through that element.
For regular pages that you connect (Optin Pages, Sales Pages, Landing Pages, etc.) a percentage box will appear in-between them. In this grey box, put in the percentage of visitors you expect to go from page A to page B. Then we'll give you the total number of visitors that went from page A to page B.

When you connect an Order Page or Upsell Page to another page, a separate sales module will appear in-between them. In the top field of this box, put in the TOTAL percentage of visitors you expect to buy from the checkout/upsell page. Now go into the sales module by clicking on the dollar sign with the green background and putting in your product names, prices, and expected % of units sold (if you only are selling 1 product in this page, you can just put 100% in the Units Sold field.)

With these traffic and conversion elements, you have everything you need to not only make projections, but to track and optimize virtually any marketing situation live.


